Very often when building an app, you get taken away in the code architecture, building different components, and getting stuff done. You want features out, and very often you don’t have time to optimise stuff. Sadly, this is the way software development has gone in recent years, especially during the IT layoffs in the recent couple of years.
One thing that always gets missed and usually gets resolved is that your app just becomes slow. ANRs or Application Not Responding is an often thing that happens with mobile apps and people learn about it only when people actually start complaining from it. “Hey, we see a dialog that says Close app” is the most common thing you will hear from users. And this is when you realized they have already opened Pandora’s box for you.
I hope with this post to make you aware of how to identify such potential issues and try to fix them before they occur. Let’s go.
Common mistakes that make your app slow
Passing info in the Dagger graph while creating objects
Dagger is such a huge pain in the ass sometimes. Let’s say you have a class that needs to set the user ID upon creation, like FirebaseAnalytics. You call in Dagger:
@Provides
fun providesFirebaseAnalytics(deviceInfo: DeviceInfo) {
    return FirebaseAnalytics.getInstance().apply {
        setUserId(deviceInfo.getUniqueId())
    }
}
Now imagine you need this class somewhere in a constructor of another class. Because Dagger needs to provide it, it instantiates it and what if the deviceInfo.getUniqueId() takes 5 seconds to get it? Tada, you just got an ANR.
Use Factories instead. You should avoid setting data in the provides**** method. This is a bad practice. Let the factory create the object for you when it is needed.
Dagger creating the object graph too soon
Did I say Dagger is a pain in the ass sometimes? Let’s say you have a Set of Observers. These are guys that want to start observing in onCreate of your app like this:
@Inject
lateinit var lifecycleObservers: Set<LifecycleObserver>

fun onCreate() {
    lifecycleObservers.forEach { it.observe }
}
Because this is a set of observers that needs to be created immediately before even onCreate is called, all of these classes will be created on the main thread, blocking it fora random chunk of time. Didn’t you want it in onCreate, not in the creation of the app class? Well, then use dagger.Lazy and problem solved:
@Inject
lateinit var lifecycleObservers: Lazy<Set<LifecycleObserver>>
Doing stuff in the init method of classes
Now let’s extend the above case. In one of those observers you have a class that has something like:
class GpsLocationObserver(private val gpsService: GpsService) {
    init {
        gpsService.start()
    }
}
This means that immediately upon provisioning the class into the set of Observers, the init block will be called the the gpsService.start() will be called. And what happens if it takes 5 seconds? Boom, ANR on startup.
Inappropriate vals
Val’s are such a love for Kotlin devs. Everyone loves writing a val. No one loves managing them later when you have decided to expose reading a complicated JSON structure in a val:
class LocationLookup {
    val pointsInBulgaria by lazy {
        Json.read(path_to_json)
    }
}
The above block of code is halfway there. At least it is in a lazy val. So you don’t execute it immediately upon app start and it will wait for the calling thread to decide where it will execute. But how about if you want to change it to use the IO dispatcher? Then you have to change half of the codebase to make it work.
Please, do not forget that suspending functions are out there. Reading any kind of file data should be done in a suspending function. Not in vals. Vals can be evil. Be mindful.
Code generation using reflection
We use Moshi for reading/receiving JSON data. In some classes, we have something like:
class MapsRepository {
    val markersAdapter = moshi.adapter(Marker::class)
}

data class Marker(val id: String, val coordinates: LatLng)
There are 2 issues in the above code block:
- markersAdapter is not lazy. It will be executed immediately upon class creation
- There is not codegen annotation above the Marker class. This means moshi will use reflection to parse the data class immediately upon the creation of the class upon the main thread and man, is reflection slow as hell.
Always make sure to:
- Use lazy for adapters
- Add code generation annotation above data classes and use ksp
@Json(generateAdapter = true)
data class Marker(val id: String, val coordinates: LatLng)
This way Moshi is way faster than before and you will also not block the main thread unnecessarily.
Not observing the backstack
You navigate between screens:
A -> B -> C -> D -> popUpTo B inclusive true
Have you ever checked what happens if popUpTo does not manage to find the destination that you pass it. It doesn’t pop it? It just says in logcat: “Destination with #id cannot be found” and that’s all. Hell, how many times have we missed this warning…
This could easily lead to your app having the same screens over and over again without you even realising it. And without having a proper log printing, I don’t know how you can easily debug the backstack. Observe it. Having the same fragments over and over can easily cause ANRs. Just because all of them using too much RAM which at some point will just cause the app to crash with OOM exception (OutOfMemory).
Not checking the internal storage the app is using
One other mistake is the app just taking too much storage and killing the device at some point. Various reasons may lie behind that. Corrupted firmware, various Firestore bugs causing Firestore to cache too much data or you writing a huge JSON to a File (and remember to do it on the IO thread/dispatcher).
At some point, the storage of the device becomes so full that you can easily brick it. So, make sure to add some analytics and to trace the storage that you are using.
Unnecessary function calls on the main thread
You have tracking in place. You call:
class Analytics(val shouldTrackEvent: ShouldTrackEventInteractor) {
    fun track(event: AnalyticsEvent) {
        if (!shouldTrackEvent(event)) return
    }
}
Your shouldTrackEvent is a class that has some business logic. Maybe you want to only track approved or non-debug events. Who knows. Why do you need to check on the main thread every time when you call track? Can’t you use the function to switch to the default dispatcher? You can, absolutely, even with the risk of losing an event, the analytics that shouldn’t be crucial for the behavior of the app. Then just switch the thread with withContext(Dispatchers.default). And tick, job is done and you have a faster app.
Compose, recompositions and more
Compose can cause unnecessary recompositions. The topic is so big that it requires a separate blog post. Spend some time analyzing them. There are some good tools to:
- See the number of recompositions
- See the stable or unstable classes / objects and add Stable or Immutable annotations
- Minify your app always when you use compose. This will make it a ton faster!
Compose should be evaluated very carefully especially if you need to support old and slow devices. I know it is the “new” kid on the block and everyone loves it but it is slow as hell even nowadays. Test it! For us it takes 3.5 seconds of blocking the main thread just to create a NavDrawer :)
Think about having a Splash screen where you init a Compose view. This will make the Compose runtime init on Splash and save you some ms where the user won’t be left stuck waiting for a screen to show up.
Don’t pass big objects in the nav between screens
Serialising and deserialising big objects in the nav graph could impact the app behavior. Do not pass whole objects around. Use IDs and Repositories to later fetch the data by ID from the repo. I know Kotlin Serialisation is cool (although it does not support enum classes extending from sealed interfaces but well, whatever) but it could still be a pain in the ass to implement it for big objects. And yes, at the end they end up at your route as strings.
Assign a job to a single-launched coroutine
You need something like:
class TransactionsViewModel() {
    fun onStart() {
        viewModelScope.launch {
             observeTransactionDetails(id).collect { }
        }
    }
}
And tadata, you have a bug. You don’t have a job for this coroutine. Why didn’t you add it? Now, each time that onStart is called, it will actually lead to multiple coroutines hanging in the memory of the app, doing the exact same thing.
class TransactionsViewModel() {
    private var job: Job? = null
    fun onStart() {
        job?.cancel()
        job = viewModelScope.launch {
             observeTransactionDetails(id).collect { }
        }
    }
}
Mapping logic on the main thread
Sometimes you map tons of stuff from one class to another. And believe it or not, it can take time. And sometimes even impact the app. As developers, we tend to forget that a nice benefit would be for a flow to execute both an API call and mapping on another thread, not on the main one. What happens often is that API call happens on a new thread (as Retrofit usually does that for us) but the mapping and tracking go to the main thread. Why not move it and make the main thread relax a bit more?
Profiling
The only way to identify to above mistakes in the codebase is to profile it. By profile I mean using the Profiler in Android Studio.
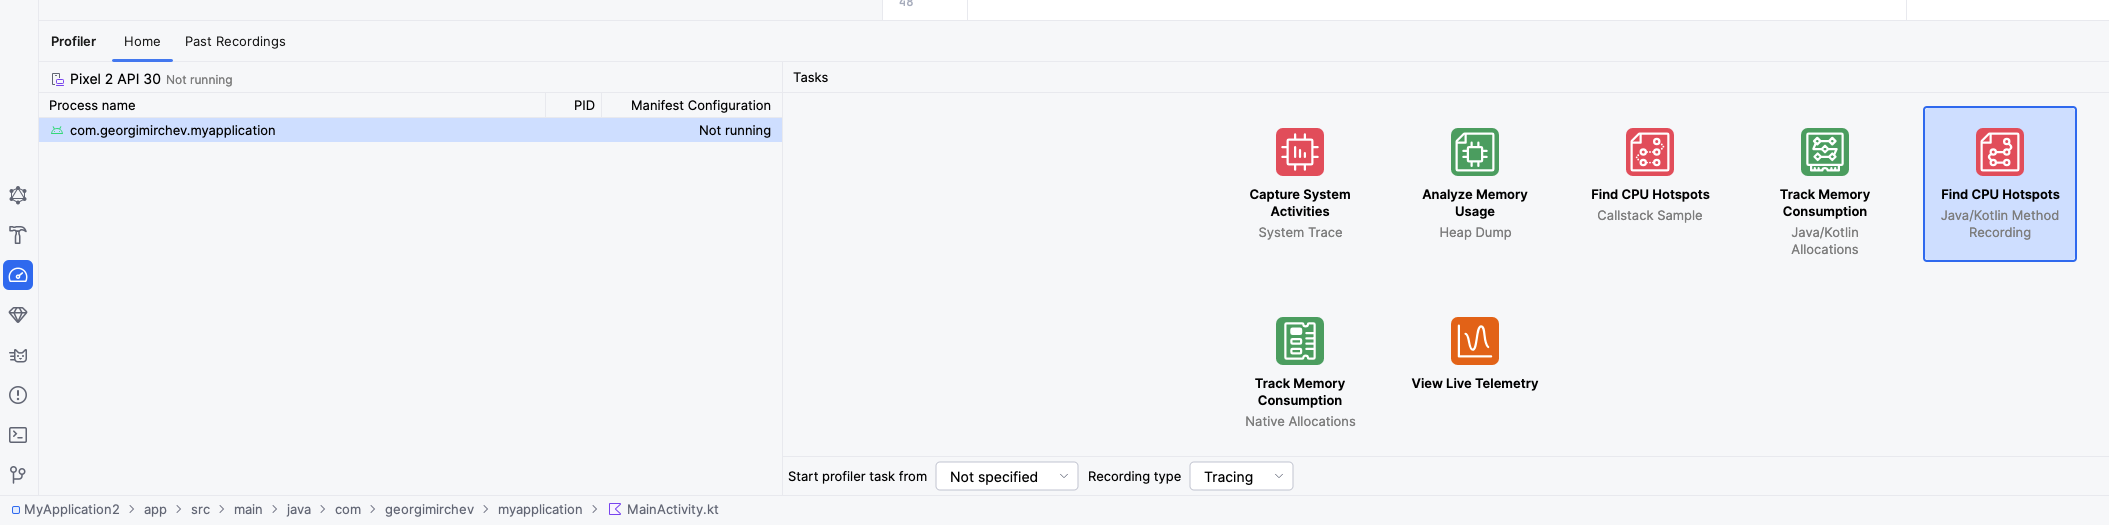
Choose Toolbar -> Run -> Profile -> with low overhead and let the app build and run. Then open the Profiler on the left side and click Find CPU Hotspot. You could trigger it from the start of the process (which would restart the app) or from now, wherever you are.
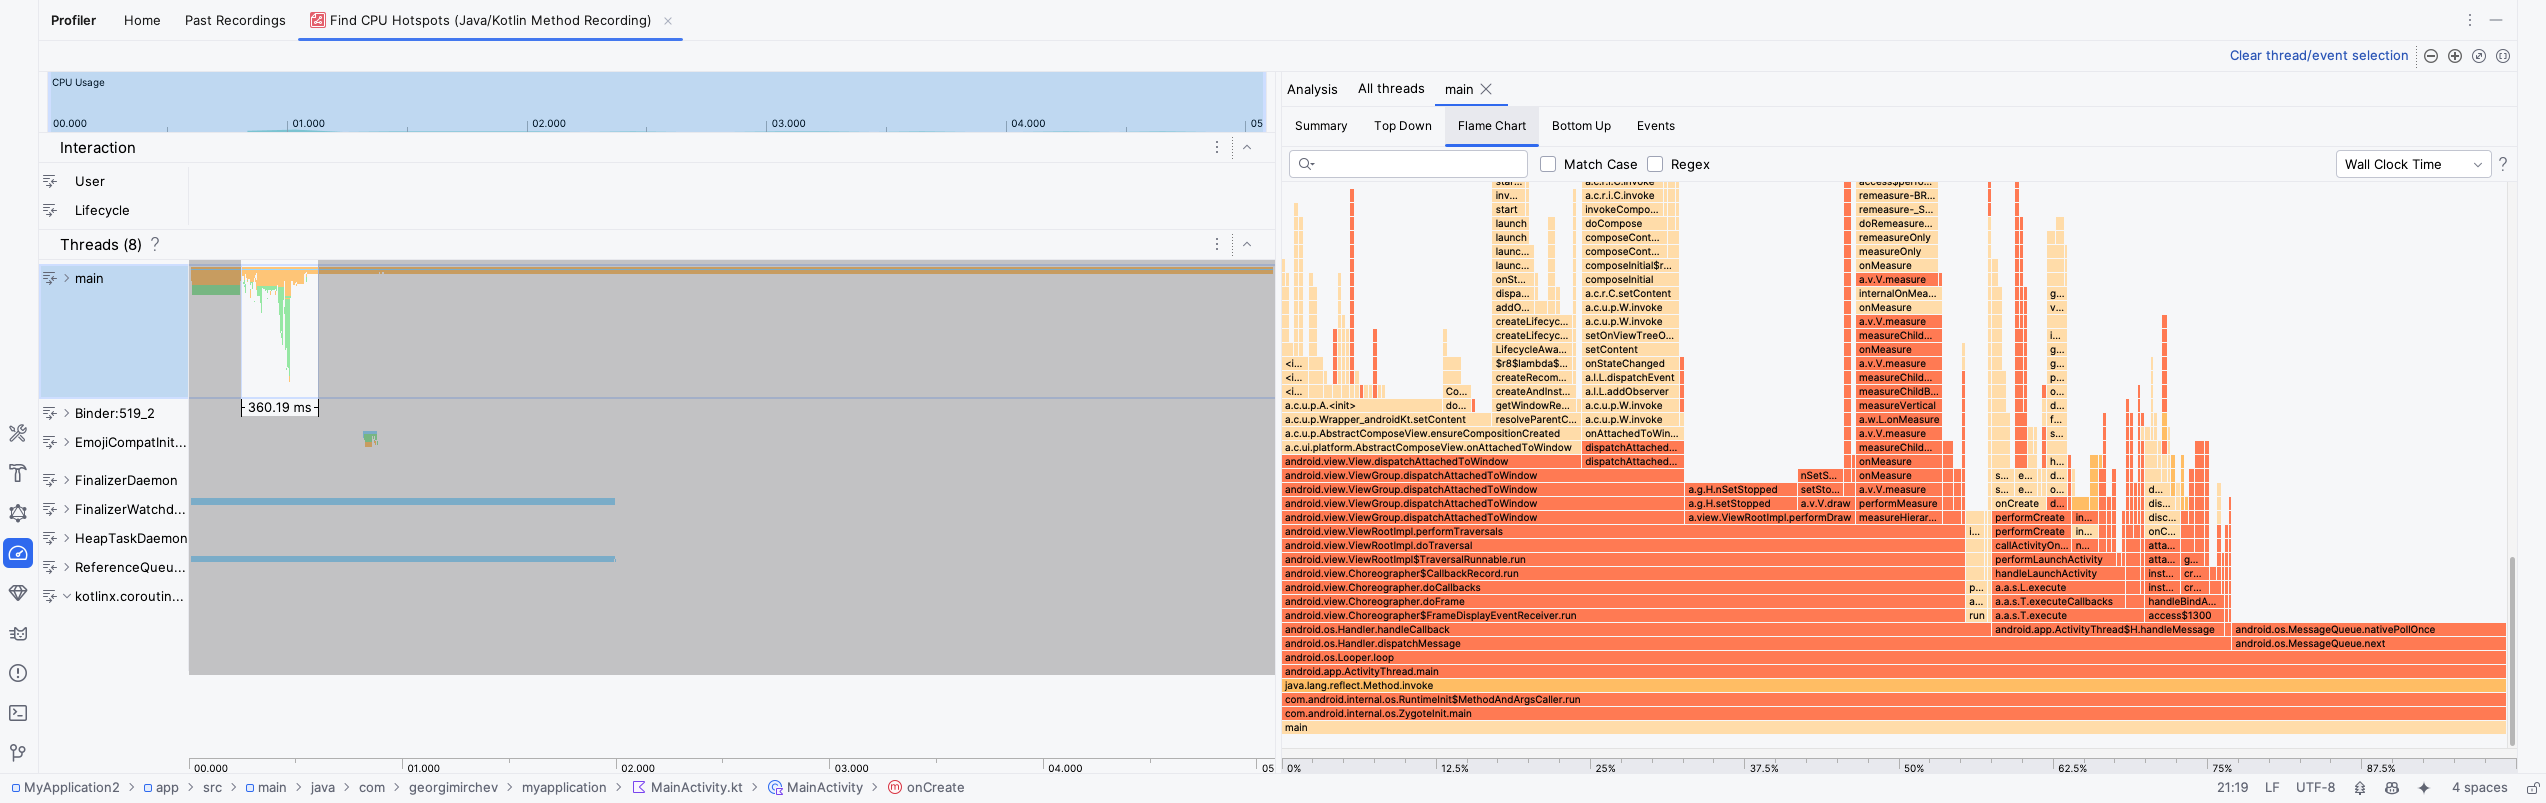
This will show you a table of various threads that you have in your app and what each one is doing. You are interested in the main one and that is what we will be looking at. The Flame Chart will show us for long running operations and by hovering on them, you can see how much time each one takes. They should not be blocking the main thread for long. Even 50 ms is worth fighting for.
Keep in mind that Profiler is quite buggy and you may need to restart the app, select the time and recording type on each attempt or anything else that may pop up. But by investigating closely the long running operations, you will be able to optimise your app for ANRs.
And good luck! You reached the end of this article which is full with pain and I hope I helped some of you to think a bit more next time you are writing some long running operation that takes a bit more time than expected!